Seven hundred and ten euros, and a three-figure effect
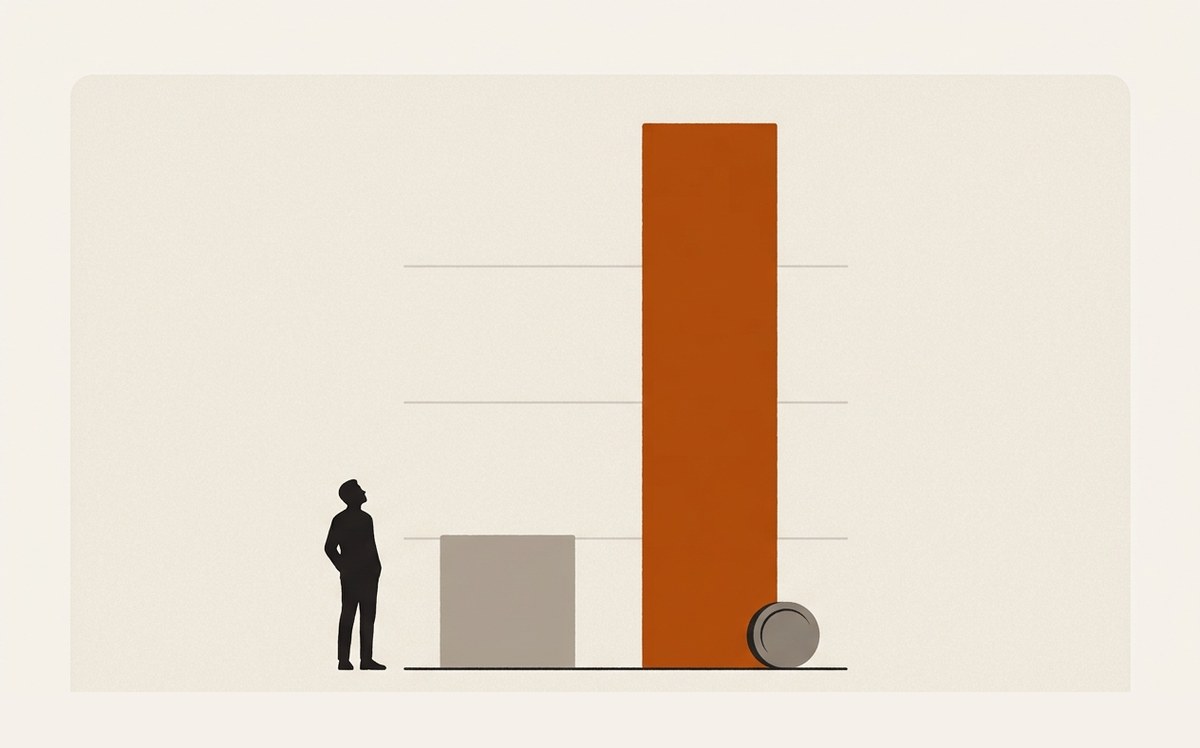
Most campaign reports compare a campaign to itself. This one compares a product page to what it was without a campaign, against the same month the previous year and against the previous month, on an isolated perimeter and a trivial budget.
The media buy: a three-figure budget over three weeks, for close to 600,000 impressions and a cost per click of 13 cents. The measured effect on the product page: +219% page views, +234% unique page views, average time on page rising from thirty-nine seconds to over a minute, and +415% social traffic to the site.
Across the whole site, unique visits rose 129% month on month, and the referral share of traffic went from 10% to 30%. It is the cleanest demonstration I know of the relationship between spend and effect, because the perimeter is small and everything in it is visible.
A home improvement retailer with two stores in an island market, a commercial catalogue that changes with every operation, and a website that acts as a shop window more than a shop. The account ran at a dense rhythm: site updated with every campaign, several hundred keywords bought, a monthly send, two social pages managed, game applications, and a monthly on-site visit. The system was installed, measured, and routine enough that a variation would show.
Proving a campaign's effect is almost always impossible, because everything moves at once: the season, the catalogue, the competition, organic traffic. Here two rare conditions came together. The perimeter was isolated, a clearance operation on one specific range, therefore one specific product page. And history existed, because the account had been measured for two years. Without those two conditions, a before-after report proves nothing, and you have to tell the client that rather than sell them a correlation.
1 · Choose a scope small enough to read.
One range, one page, a three-week window. The wider the scope, the more competing explanations there are for the effect observed. A small, well-measured scope is worth more than a large, debatable one.
2 · Compare against two references, not one.
The previous month, and the same page without a campaign. Two comparison points are enough to rule out the most obvious seasonal explanation, and they cost nothing since the data is already there.
3 · Look at time spent as much as volume.
Volume says people came. Time on page says they looked. Going from thirty-nine seconds to more than a minute on a product page changes the reading: this traffic cares about the product.
4 · Follow the shift in sources, not only the total.
The share of referring sites moving from 10% to 30% says more than the rise in total traffic. It says where the effect comes from, and so which lever to pull again next time.
5 · Reuse the same protocol on openings.
The same account was used to measure the opening of a second store: nearly seven thousand new followers for a little over one thousand two hundred euros, a cost per follower of 17 cents, the best in the portfolio on a launch operation. The construction-site posts carried the highest engagement of the year on that page.
2013 and 2014 campaigns, isolated perimeter.
- A three-figure media buy over three weeks, close to 600,000 impressions, cost per click of 13 cents
- +219% page views and +234% unique page views on the product page concerned
- Average time on page from thirty-nine seconds to over a minute
- +415% social traffic to the site over the period
- +129% unique site visits month on month, referral share from 10% to 30%
- On the second store opening, cost per follower of 17 cents, the best in the portfolio
A tiny budget, well measured, is more convincing than a large one badly attributed. What makes this report solid is not the size of the effect, it is the size of the perimeter: small enough for the effect to be attributable, tracked enough for a variation to show. If you cannot isolate a perimeter, you are not measuring, you are narrating.
Can you isolate a perimeter and prove the effect?
The first call30 minutes. We talk about your traction and what is blocking it. You leave with 2 or 3 moves you can act on. No pitch.
The client was cutting print because it proved nothing
Constraint: taking budget from an incumbent medium, with proof.
Read the case studycountry budgets, one group budget, one rule
Constraint: ten markets, ten budget formats, no line authority.
Read the case studyHalf the agency's margin came from business I had won
Constraint: selling and producing with the same people.
Read the case studyPublishing prices and lead times, in an agency, in 2014
Constraint: selling digital to a market that was not buying it yet.
Read the case study